database

The wrong birthday assumption

Date_Entry.png

Many years ago, back in the late 80’s, one of my first big development contracts was to create a database for NAALAS - the North Australian Aboriginal Legal Aid Service (no longer around).

Basically, this organisation provided legal assistance for Aboriginal people to help them through the quagmire that is the Australian legal system. The database I would design would be a case management and recording system that would enable their legal team to keep track of the progress of their client’s cases through what could be a many year long arduous process.

On the surface, it was a fairly simple database design, and at the time, I designed it using dBase III before migrating it over to Clipper eventually.

But at the outset, I made one critical mistake in the schema design for the client record. I had all the standard ‘people’ fields such as first name, last name etc., as well as a standard date field to capture the birth date of the client.

And that was where things fell apart when we went ‘live’.

You see, there were quite a lot of Aboriginal elders on their client files, and it turns out that a lot of Aboriginal people born in outlying communities do not actually know the exact date of their birth. Most of them only knew the month and the year, and some older ones only knew the year!

But they still needed to capture as much as they could of the birth details, and dBase’s date field could not capture partial dates when the operators tried entering in 00/05/1958, or 00/00/1947 etc.

This means a last minute rush back to the drawing board where I had to break up the birth date entry field into three separate (optional) entry fields for the date, month and year, and then only complete the actual birthdate field programatically in the back end only if all three components were present.

Reports still had to be generated on these ‘dates’, i.e. all clients who were born between 1960 and 1970 etc., so there was some judicious workaround implemented in the system to still accommodate this using partial or complete dates.

It was an early lesson that stuck with me to this very day, and still influences all design decisions I make around database schemas and user interfaces.

Finding and fixing slow queries

I love dashboards, and I run several on my system to monitor my HR startup in real time. I love collecting data points around subscriptions, user activity, and most importantly, server uptime and performance. Especially now that we are growing to thousands of customers and tens of thousands of employees using our system on a daily basis, I am finding that a lot of things that we built in the early days are starting to show cracks and issues.

Most of this would have been hidden from my knowledge, except for the fact that we have been using AppSignal for our application monitoring for just over a year now, and the AppSignal dashboards and one screen that I keep checking several times a day to ensure that everything is just ticking along fine.

One thing that I have noticed of late though, is the page rendering speed was slowly creeping up. Pages that were taking 1 to 2 seconds to build and render on the server side were now taking 5 to 8 seconds, sometimes 10 seconds plus. This was, of course, unacceptable, and would be severely impacting the user experience for our customers and their employees.

Hunting For The Problem

I was curious as to what was causing these slow downs, and luckily, AppSignal’s fantastic dashboard actually allows me to click on one of these peaks on the chart, and see exactly what was happening at this point, like so:

HRP_AppSignal_1.png

From this, it will show a breakdown of all the App processes that were running at this particular point in time, making it easy to identity the ‘slow process’:

HRP_AppSignal_2.png

And furthermore, clicking on the process name above, will show you an ‘execution timeline’, showing all the calls and database activity, along with the execution time for each:

HRP_AppSignal_3.png

This makes it so easy to see the actual database query that was causing the slowdown in the first place.

HRP_AppSignal_4.png

This is showing the actual SQL code that is running slowly in this instance.

Identifying The Underlying Cause

So what was the issue? The answer was actually quite easy to deduce by the above database query tracing, and it had a lot to do with how Ruby ORMs (Object Relational Mappers) work. What is an ORM? Well, to simplify the explanation, it is basically a way for Ruby to treat a database store as just another Ruby object, allowing you to manipulate it just like a normal Ruby object without worrying about knowing SQL (Structured Query Language) or any underlying database commands.

To explain it in layman’s terms - lets say you have a database table called ‘Employees’, and you also have another table called ‘Departments’. Now, each employee can belong to exactly one department, so you can set up a relationship between the two tables so that there is a department_id field in the Employees table, which links to the id within the Departments table.

SQL_Diagram_1.png

Now, because we have many different companies using our HR system, we need to also have a Company database, and link each Employee, AND each Department to a company by using a company_id field to separate them. Each company can have their set of employees, and each company can also have their own unique set of departments.

SQL_Diagram_2.png

Looks a bit complicated right? And handling this in SQL would be a tricky thing, however, the DataMapper Ruby ORM that we use to layer on top of our database actually makes this extremely easy. In fact, to access, for example, all employees in Company ‘Acme Industries’, who are in the Department called ‘Finance’, it would be as easy as executing this:

Ruby_Statement_1.png

And it would work straight away. No need to worry about table joining etc. - the ORM takes care of all of that for us, and gives us the results we desire… or does it?

Let’s look at the SQL query that we would normally do to get the same result, using a standard SQL INNER JOIN clause:

SQL_Statement_1.png

A lot more complicated, isn’t it? BUT… it is super fast, and able to pluck out employees from a table with thousands of companies and millions of employees in less than a second. That is the beauty of raw SQL.

However, when I look at the raw SQL being generated by our DataMapper ORM, it was a little different. Now, with SQL, there are many ways to skin a cat, and it looks like DataMapper was taking the easiest pathway. After all, multi table joins are complicated - just look at the query above! What DataMapper was doing was splitting the query into three parts based on the things being asked of it. Here was the resulting code:

SQL_Statement_2.png

It is important to realise that this is actually giving the EXACT SAME result as the raw SQL query above, but it is doing it in a slightly different way.

But why was it running so much slower that it should have? It didn’t really make sense.

But then, we realised it. It was all coming down to Step 2 of the DataMapper query, which was staring at us in the face when we looked at the AppSignal logs.

Fixing The Problem

You see, now that we had thousands upon thousands of customers in the system, almost all our customers had a Department called ‘Finance’ in their companies. So Step 2 was actually returning THOUSANDS of department IDs that Step3 was trying to look for. Of course, most companies only have ONE department called ‘Finance’, so the third step should have only been looking for one company_id and ONE department_id, but it was not. All because we had not specified a qualifier for the Departments table.

Changing the DataMapper query to the following helped to increase the speed of the query quite significantly:

Ruby_Selection_2.png

As you can see, we had to add the qualifier:

:company => {:name => “Acme Industries”}

to the Department file as well.

This resulted in the following conversion to SQL:

SQL_Statement_3.png

So while the Ruby method now looks like we are duplicating things a little, it actually works better in terms of database performance.

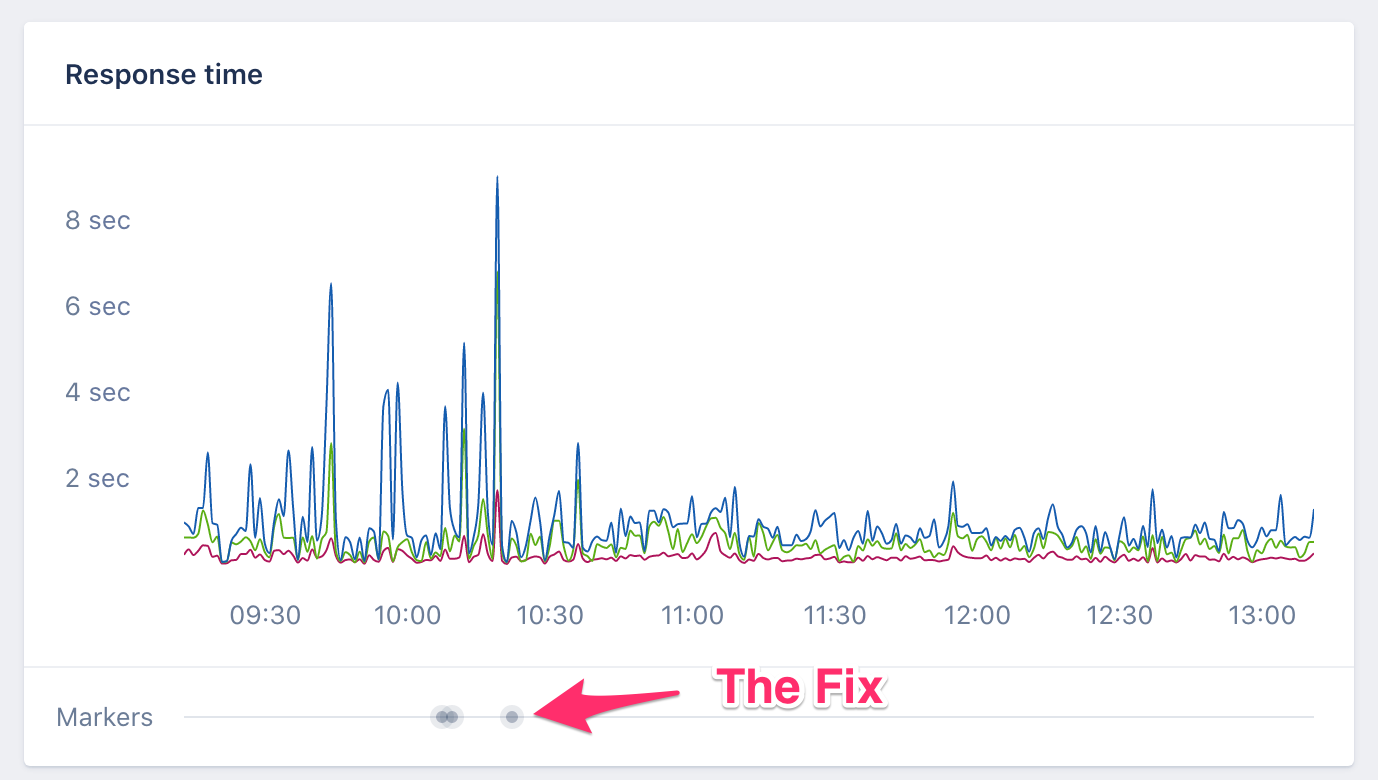
To show you the difference, here is the AppSignal dashboard for page rendering speed before and after we made the fix:

Page Response Fix.png

Look at the drop in average page responses from 4 to 6 seconds, down to 2 seconds or less.

This didn’t stop here. Motivated by these gains, I went ahead and kept looking at later spikes to see if there was anything else on our dashboard that could be optimised. Sure enough, I found a couple of other queries that had the same issue, and I fixed those too:

Page Response Fix 2.png

Most big spikes gone! What a win.

This just goes to show the importance of an application monitoring tools such as AppSignal or any other APM (Application Performance Monitoring) tool for your SaaS. A lot of time, you won’t realise that certain optimisations will be needed when you have a smaller data set. It is only as you grow that you start to see some of these bottlenecks, and a good tool will certainly help narrow down where you should be working on.

Most times, people just upgrade server capacity, or throw more caching solutions in the mix, but all that costs extra money, and if you a bootstrapped startup like us, this sort of fix cost $0. Actually, in terms of AppSignal subscription price, it has pretty much paid for this whole year’s subscription to their service in terms of cost savings from our hosting provider.

Making my code run 3000 times faster!

Photo by Abed Ismail on Unsplash

Photo by Abed Ismail on Unsplash

I first started using the MySQL database system way back when version 2 was released. I cut my teeth on writing SQL queries using that system, even when it still didn’t have nested SELECTs, which entailed me really getting to grips with hand optimised JOIN commands.

But over the years, as better tools and layers of abstraction evolved, I began to touch the raw SQL less and lees, and began to rely on these other tools to do the heavy lifting for me.

My latest startup uses the newest, shiniest version of MySQL to store data, but I am several steps removed from the data store via a Ruby ORM (Object Relational Mapping). Basically, I just define all the database elements as standard Ruby objects, and the system just takes care of everything for me.

It works well 98% of the time, but sometimes there is a problem, like the one I will describe below.

Plenty of space, really! 😅

Plenty of space, really! 😅

In my SaaS app, we allow our users to store document attachments against their employees. We have a handy little widget in the footer of every screen to show our users just how much of their allotted storage they are presently using.

Now, this widget used to do a quick calculation upon every page load. Initially it worked well, with only a few extra milliseconds being added to page load time, but as our system grew, and we allowed attachments in different areas (i.e. Company Library, Job Applicants, e-Signatures, Expense Claim receipts etc.), we started to find that this page load time was actually being increased to over a second - sometimes even a couple of seconds per view, which really impacts the overall snappy feel of the app.

What started as this…

What started as this…

Quickly became this…

Quickly became this…

How would we solve this? Well, we decided to transition from a live, real time calculation, to running a process every couple of hours (in the background) that would go through the file attachment tables and tally up the total storage amount and store that in a database field somewhere. The screen rendering process would then just present the value of that database field on the screen each time.

So we would lose the real time aspect, but customers would still see their storage allocations up to only a couple of hours of lag time. Best thing was that page loads were back up to nearly instantaneous again.

We built a utility routine that runs on our background worker server to run these calculations every 4 hours (on a CRON timer). But the problem was, the routine would have to run through our entire active customer list of 1700+ companies, and tally up all the attachments across the different files in different areas, and store it in the company masterfile. That routine would take up to 45 minutes to run! AND it was also spiking the CPU of the worker server so that other critical background tasks (like calculating leave, handling Slack notifications and important emails) was being impacted and delayed.

We tried several things like spawning several concurrent Threads to run part of the task in, but still no joy. I kept getting critical alerts in the middle of the night that our worker instances were down or struggling with the load. Clearly not acceptable.

This was a frustrating issue, and the team, including myself, were struggling to solve it. But then it dawned on me. We were getting lazy. Our immediate ‘go to’ solution was to stick with Ruby and the ORM and our background worker to solve a background task. What if there was another way?

Looking at the problem, there were no real external inputs required. The task was simply to step through the customer database row by row, then find the associated records (which was easy, because we have keys linking them all), and run a SUM query and then total up all those SUMs and save it in the main company database.

Why weren’t we just doing this in SQL directly? But also, MySQL now has the concept of ‘Scheduled Events’, where you can store regular housekeeping routines right within the database that can to routine queries on a fixed interval. No need to set up a timer on our worker server at all.

So I opened up a MySQL query console, and typed up a query that would do the totalling of all the attachment records and perform an UPDATE on the company row.

Nested selects…. nested selects everywhere!

Nested selects…. nested selects everywhere!

I ran the query.

It took…. 0.8 seconds!

Let me say that again - it took LESS than a second to run. Compared the worker thread we used to do the EXACT SAME thing that took 45 minutes+. That is about 1/3000th the time.

Best of all, it completely takes the load off our worker server. I think the database CPU spiked about 2% for that 1 second timeframe. This meant that instead of running every 4 hours, we could schedule the task to run every hour. Heck, we could even run it every 5 minutes if we wanted to, but I don’t want to get that crazy unless customers really demand it.

It was a valuable lesson to me that complacency and laziness can really be a detriment in a growing business. When you have a hammer, everything looks like a nail, and we were so wrapped up in the comfy perceived safety and convenience of our Ruby ORM that it hadn’t really occurred to us that we could take the covers off and get down to the nuts and bolts to solve the issue in the first place.

Next time there is a problem like this in my startup, I will go back several decades in my working life again, and see if I can roll up my sleeves and fix it the ‘good old fashioned way’.